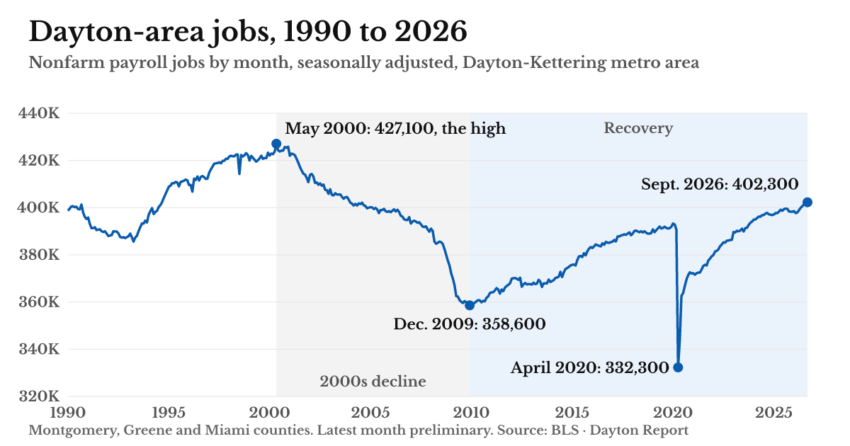
The Dayton-Kettering metro area had 402,300 nonfarm payroll jobs in September 2026, according to preliminary, seasonally adjusted figures from the U.S. Bureau of Labor Statistics. That is 2,800 more than in September 2025, and the most since December 2003, when the count was 403,500.
The metro’s highest count in the series, which begins in 1990, was 427,100 in May 2000. September 2026’s count is 24,800 below that.
City staff cited the same 402,300 figure at the Dayton City Commission’s Nov. 4 meeting (our recap).
Since 1990
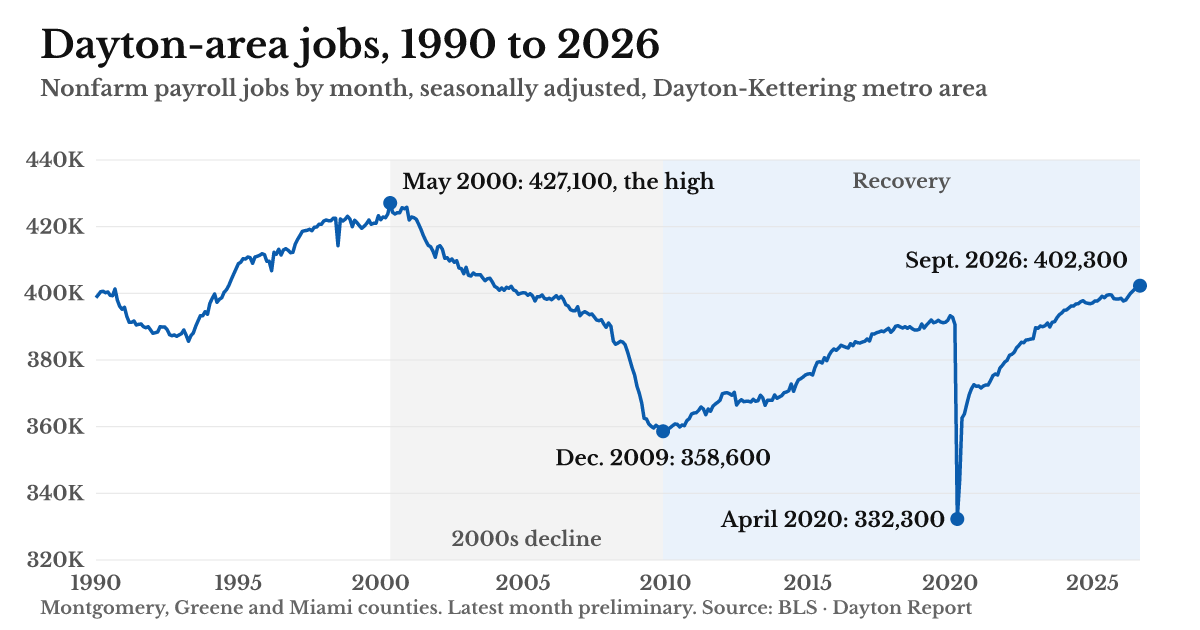
From the May 2000 high, the count fell to 358,600 by December 2009, 68,500 fewer jobs. It had climbed back to 392,800 by February 2020, then dropped to 332,300 in April 2020, at the start of the pandemic. It returned to its pre-pandemic level in November 2023. September 2026’s count is 43,700 above the 2009 low.
Which industries added jobs
By industry, the BLS publishes the metro’s figures without seasonal adjustment, so these compare September 2026 with September 2025. On that basis the metro added 3,300 jobs over the year (398,900 to 402,200). Gains: education and health services (+2,200), professional and business services (+700), mining, logging and construction (+600), leisure and hospitality (+600), manufacturing (+400), trade, transportation and utilities (+400). Losses: information (−200), financial activities (−200), other services (−400), government (−800).
| Industry | Sept. 2025 | Sept. 2026 | Change |
|---|---|---|---|
| Education and health services | 80,900 | 83,100 | +2,200 |
| Professional and business services | 53,300 | 54,000 | +700 |
| Mining, logging and construction | 15,700 | 16,300 | +600 |
| Leisure and hospitality | 38,800 | 39,400 | +600 |
| Manufacturing | 41,700 | 42,100 | +400 |
| Trade, transportation and utilities | 70,700 | 71,100 | +400 |
| Information | 5,300 | 5,100 | −200 |
| Financial activities | 15,700 | 15,500 | −200 |
| Other services | 14,400 | 14,000 | −400 |
| Government | 62,400 | 61,600 | −800 |
Dayton, Ohio and the U.S.
Over the same 12 months, seasonally adjusted, jobs grew 0.7% in the Dayton metro, 0.3% in Ohio and 0.4% nationally, so the metro grew faster than both.
| Sept. 2025 | Sept. 2026 | Change | |
|---|---|---|---|
| Dayton | 399,500 | 402,300 | +0.7% |
| Ohio | 5,669,600 | 5,688,300 | +0.3% |
| U.S. | 158,548,000 | 159,128,000 | +0.4% |
How we measured
These are payroll jobs counted where people work, not where they live, from the Bureau of Labor Statistics’ monthly survey of employers (Current Employment Statistics), for the Dayton-Kettering metropolitan statistical area: Montgomery, Greene and Miami counties. The headline figures and the chart are seasonally adjusted, which removes the usual swings of the calendar, so one month can be compared with the next. The industry figures are not seasonally adjusted, so they are compared with the same month a year earlier; their total (402,200) differs from the seasonally adjusted count for that reason.
September 2026’s figures are preliminary. The BLS revises the latest months as more employers report, and each March it re-benchmarks the past year and more to fuller counts from state unemployment insurance records, which can move these numbers in either direction.
Sources: U.S. Bureau of Labor Statistics, Current Employment Statistics, through the Federal Reserve Bank of St. Louis (FRED): Dayton-Kettering MSA total nonfarm, seasonally adjusted (SMS39194300000000001) and not seasonally adjusted (SMU39194300000000001), by industry (10 supersectors, not seasonally adjusted), Ohio (OHNA) and the U.S. (PAYEMS), seasonally adjusted, January 1990 through September 2026. Analysis by Dayton Report. Every month since 1990: jobs in the Dayton metro.
For the numbers in your inbox, sign up for the Dayton Report newsletter.
Follow Dayton Report: Facebook · X · Get the Dayton weekend email
