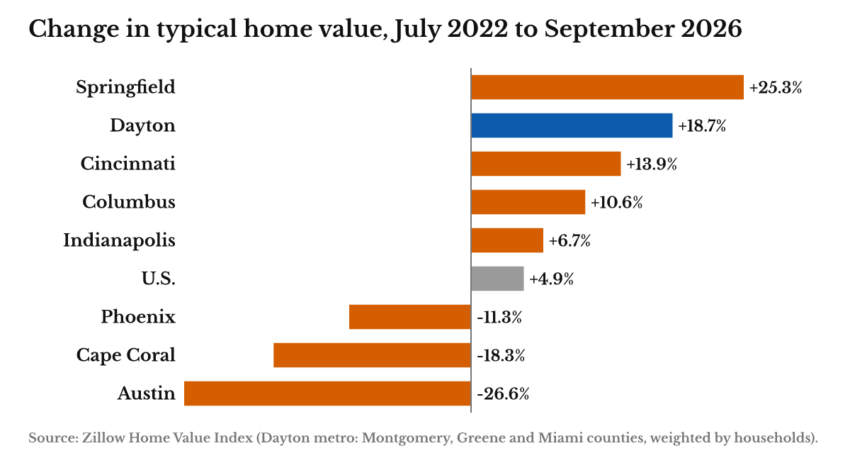
The typical home in the Dayton metro was worth $231,372 in September 2026, up 18.7% from July 2022, when national prices peaked, by the Zillow Home Value Index. Over the same stretch the U.S. figure is up 4.9%, Austin’s down 26.6%, Cape Coral’s down 18.3% and Phoenix’s down 11.3%. Of the eight metros compared here, Dayton ranks No. 2 for growth since then.
Prices since the peak
In the past year, Dayton-area values moved up 2.9%, against up 1.2% nationally. The metros that boomed hardest during the pandemic are the ones giving it back: Austin’s typical value is $414,273, down 26.6% from July 2022. Cincinnati is up 13.9%, Columbus up 10.6% and Indianapolis up 6.7%. Springfield, Clark County’s own metro, is up 25.3%.
This is not how the last downturn went here. From July 2006 to July 2010, Dayton-area values went down 13.5%, against 17.1% down nationally, 57.2% down in Cape Coral and 49.4% down in Phoenix.
| Metro | Typical value, September 2026 | Since July 2022 | Past year | July 2006 to July 2010 |
|---|---|---|---|---|
| Dayton | $231,372 | +18.7% | +2.9% | -13.5% |
| U.S. | $366,157 | +4.9% | +1.2% | -17.1% |
| Springfield | $199,688 | +25.3% | +3.2% | -11.3% |
| Cincinnati | $305,940 | +13.9% | +2.2% | -7.8% |
| Columbus | $326,910 | +10.6% | +1.3% | -8.7% |
| Indianapolis | $291,634 | +6.7% | +1% | -0.6% |
| Phoenix | $441,097 | -11.3% | -1.1% | -49.4% |
| Cape Coral | $334,479 | -18.3% | -3.5% | -57.2% |
| Austin | $414,273 | -26.6% | -4.3% | +1.8% |
Homes for sale
Realtor.com counted 2,170 homes for sale in the Dayton metro in October 2026, 10% more than the 1,975 it averaged in 2018 and 2019. Nationally, listings are 1% above that level; in Austin they’re 60% above it and in Cape Coral 7% above. Per 1,000 households, Dayton has 6.2 listings, against 8.8 for the U.S.
What it costs to buy instead of rent
At Freddie Mac’s 30-year rate for the week of November 5, 2026, 7.18%, buying the typical Dayton-area home ($231,372) with 10% down means a principal and interest payment of about $1,411 a month. Add property tax of about $4,179 a year (the middle of the range across the three counties’ taxing districts for an owner-occupied home, from the Ohio Department of Taxation’s tax year 2025 rates) and our assumption of $1,500 a year for homeowners insurance, and the total is about $1,884 a month, before any mortgage insurance.
The typical asking rent in the Dayton metro was $1,320 a month in September 2026, by the Zillow Observed Rent Index, and the median rent renters actually paid was $1,149 in 2025, by the Census Bureau’s American Community Survey. Nationally, the same purchase math on the typical U.S. home ($366,157) comes to about $2,232 a month in principal and interest alone, against a typical asking rent of $1,932. In Dayton, principal and interest run $91 a month above the asking rent; nationally, principal and interest run $300 a month above the asking rent.
Building during the boom
From 2019 through 2021, the Dayton metro permitted 2 new homes a year for every 1,000 residents, by the Census Bureau’s Building Permits Survey. The U.S. figure was 4.6, Austin’s 18.3, Cape Coral’s 14.5 and Phoenix’s 9.3.
Price against income
In 2019 the typical Dayton-area home was worth 2.4 times the metro’s median household income ($58,169, Census ACS). In 2025 it was 2.9 times (income $76,029). For the U.S., the same measure went from 3.7 to 4.3. Dayton remains below the national ratio.
A new federal limit on the largest landlords
The 21st Century ROAD to Housing Act, Public Law 119-101, became law on July 11, 2026. Section 1001 bars a for-profit entity that controls 350 or more single-family homes, alone or together with affiliated entities, from buying more. It makes exceptions, among them newly built homes for sale, build-to-rent programs, renovate-to-rent purchases with improvements worth at least 15% of the price, and homeownership programs. The ban takes effect January 7, 2027 and ends 15 years later. The Treasury Department proposed its rule for carrying it out on Oct. 23, 2026, with public comments due Nov. 23.
How we did this
Home values: Zillow Home Value Index, all homes, middle third of values, smoothed and seasonally adjusted, monthly through September 2026 (Zillow Research). Zillow’s metro file has no Dayton entry, so the Dayton metro figure is our household-weighted average of Zillow’s values for Montgomery, Greene and Miami counties, the three counties of the Dayton-Kettering-Beavercreek metro, using the Census Bureau’s 2025 household counts. July 2022 is the national peak month in Zillow’s U.S. series. As a check on our Dayton figure, the Federal Housing Finance Agency’s all-transactions house price index, which measures differently, rose 26.3% for the Dayton metro from the third quarter of 2022 to the second quarter of 2026, against 15.6% for the U.S. Rent data: Zillow Observed Rent Index (ZORI), Zillow Research. Zillow Observed Rent Index for typical asking rent.
Homes for sale: Realtor.com Residential Data, active listing count, metro and national histories, October 2026 against the average of the 24 months of 2018 and 2019. Mortgage rate: Freddie Mac Primary Mortgage Market Survey, 30-year fixed, weekly, through the Federal Reserve Bank of St. Louis. Property tax: Ohio Department of Taxation effective residential rates, tax year 2025, with Ohio’s 10% and 2.5% rollbacks for an owner-occupied home. Insurance: our assumption, $1,500 a year; costs vary by home.
The law: the enrolled text of Public Law 119-101 from the Government Publishing Office, and the Treasury Department’s proposed rule, 91 FR 66799 (Federal Register document 2026-21675).
Building: U.S. Census Bureau, Building Permits Survey, annual metro and national totals, 2019-2021 (all housing units), total units, divided by each metro’s 2020 Census count and by three years. Income, rent paid and households: Census Bureau American Community Survey 1-year estimates, 2019 and 2025 (tables B19013, B25064 and B11001). Figures are not adjusted for inflation.
More on local prices: the weekly housing pulse and ten years of Dayton affordability.
Follow Dayton Report: Facebook · X · Get the Dayton weekend email
