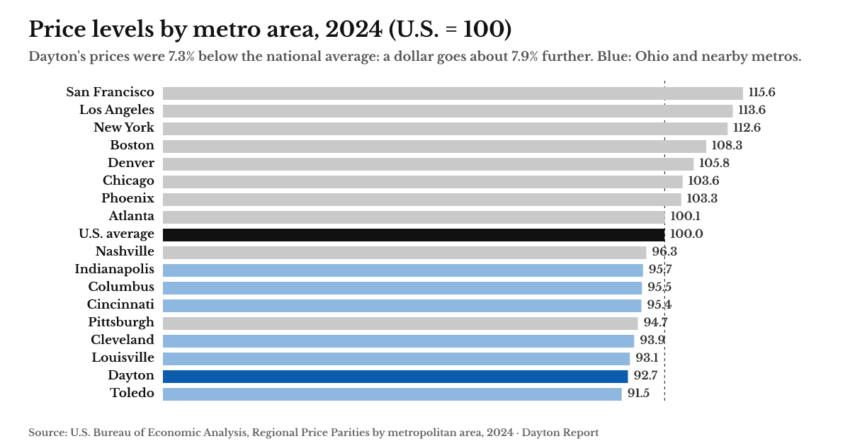
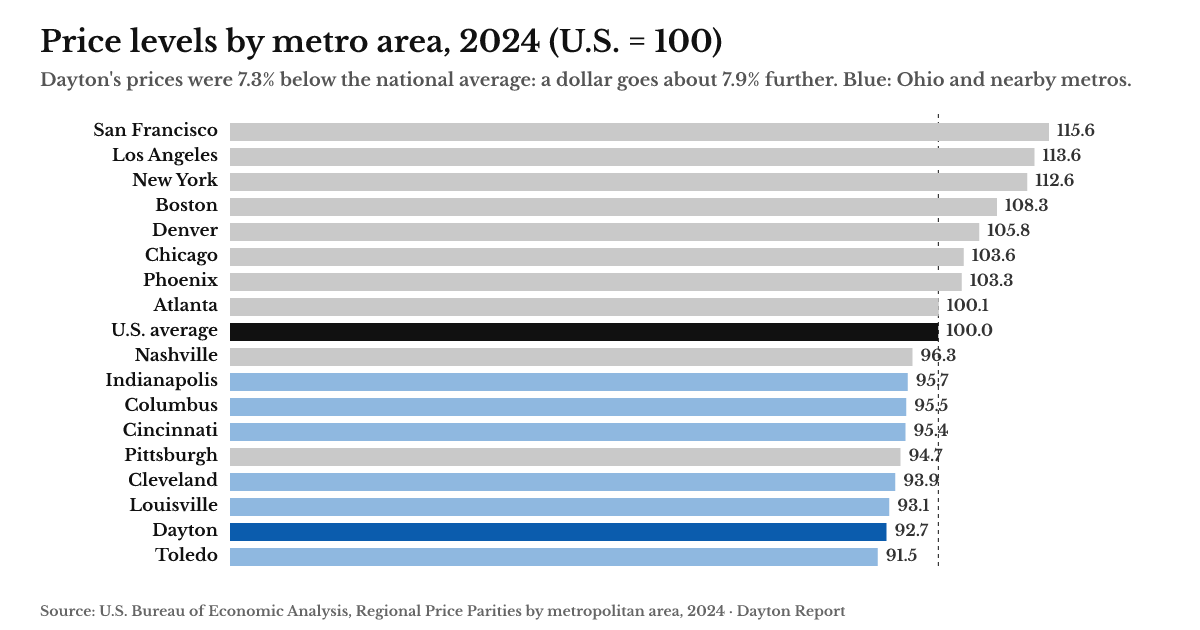
Prices in the Dayton area were 7.3% below the national average in 2024, according to the latest regional price parities from the U.S. Bureau of Economic Analysis. Put another way, a dollar spent in the Dayton-Kettering-Beavercreek metro area buys about 7.9% more than it would at average U.S. prices.
The difference is mostly housing. Everyday goods, utilities and services cost close to what they do elsewhere, while incomes here are lower than the national median, which takes back part of the advantage. Here is how the numbers compare.
How the Dayton area compares
Of the 17 metro areas compared here, only Toledo (91.5) had a lower overall price level than Dayton (92.7) in 2024, on a scale where the U.S. average is 100. The other nearby metros were within a few points: Indianapolis 95.7, Columbus 95.5, Cincinnati 95.4, Cleveland 93.9, Louisville 93.1.
At those price levels, what costs $50,000 a year in the Dayton area would cost about $53,941 at average U.S. prices, $55,880 in the Chicago area and $62,363 in the San Francisco area.
Housing is where the gap is
BEA breaks the price level into parts. For the Dayton area in 2024: housing (rents) 72.7 (U.S. 100.6); goods 93.6 (U.S. 99.6); utilities 95.4 (U.S. 98.4); other services 98.9 (U.S. 100.1). Housing costs, measured by rents, were about 28% below the national level; the other parts were within about 6%.
Home prices tell a similar story. The median sale price in the Miami Valley was $250,000 in October 2026, 2.1% lower than a year earlier, according to Dayton REALTORS® MLS data. Principal and interest on a median-priced Montgomery County home, with 20% down at that month’s average 30-year rate, took 20.3% of the county’s median household income in October 2026, compared with 20.2% a year earlier. Sales and prices by area.
Everyday costs
Energy. At the default supply rates, AES Ohio’s 10.86¢ per kilowatt-hour and 46.64¢ per hundred cubic feet of natural gas, a home using 1,000 kWh and 70 Ccf a month pays about $141.25 for supply in November 2026, before delivery charges, according to the Public Utilities Commission of Ohio’s Energy Choice Ohio charts. BEA’s utilities index for the area was 95.4, close to the national 98.4.
Gas. Regular gasoline averaged $4.17 a gallon in the Midwest in October 2026, compared with $4.31 nationally, by the U.S. Energy Information Administration’s weekly survey. EIA does not publish a Dayton figure.
Groceries. A gallon of milk, a dozen eggs and a pound each of white bread, ground beef, whole chicken and ground coffee cost $26.40 together in September 2026 at U.S. average prices, compared with $27.01 a year earlier, by Bureau of Labor Statistics figures. BLS no longer publishes Midwest averages for all six items; BEA’s goods index for the Dayton area, which includes groceries, was 93.6.
Added together, the mortgage payment on a median-priced home, a month of energy supply and 40 gallons of gas came to 25.9% of Montgomery County’s median household income in November 2026, by Dayton Report’s measure.
The other side: incomes
Lower prices come with lower pay. Montgomery County’s median household income was $66,349 in 2024, according to the Census Bureau’s Small Area Income and Poverty Estimates, 18.7% below the U.S. median of $81,604 and below Ohio’s $72,259. Adjusted for the area’s lower prices, the county’s median income is worth about $71,579 at average U.S. prices, still about 12% below the national median.
The price advantage has also narrowed slightly. The Dayton area’s price level was 91.5 in 2022 and 92.7 in 2024, as prices here rose a little faster than the national average; in 2008 it was 96.0.
About these numbers
Regional price parities compare price levels across places in the same year, using the Consumer Price Index and housing data, so 92.7 means prices about 7.3% below the U.S. average; they do not measure inflation over time. The 2024 figures, released in December 2025, are the latest. The Dayton-Kettering-Beavercreek metro area covers Montgomery, Greene and Miami counties. Sources: U.S. Bureau of Economic Analysis, Regional Price Parities; Census Bureau, Small Area Income and Poverty Estimates; PUCO Energy Choice Ohio; EIA retail gasoline prices; BLS average prices; Freddie Mac’s Primary Mortgage Market Survey; Dayton REALTORS® MLS closed sales.
For the numbers in your inbox, sign up for the Dayton Report newsletter.
Based on information from Dayton REALTORS® MLS for the period January 1, 2019 through October 31, 2026. Analysis by Dayton Report.
Follow Dayton Report: Facebook · X
